AI Search Sources & Citations Study 2026

Ricardo Matos
Research Study

What content actually influences e-commerce AI answers
The short answer
E-commerce AI answers are built from a mixed source ecosystem. In this study by Oppin, product pages were the largest individual format, representing 27.3% of 17,450 source uses. But editorial content was more influential in aggregate: articles, listicles, reviews, comparisons and how-to guides together accounted for 53.4%.
Most influence also happened away from the audited retailers’ own websites. Their domains produced only 2.2% of source use. Third-party retailers, publishers, blogs, public institutions, forums and social platforms supplied the remaining 97.8%.
And a source being used did not mean shoppers could see it. The use-weighted surfaced rate was 33.0%, meaning the visible-citation layer was much narrower than the research layer behind the answers.
Key findings
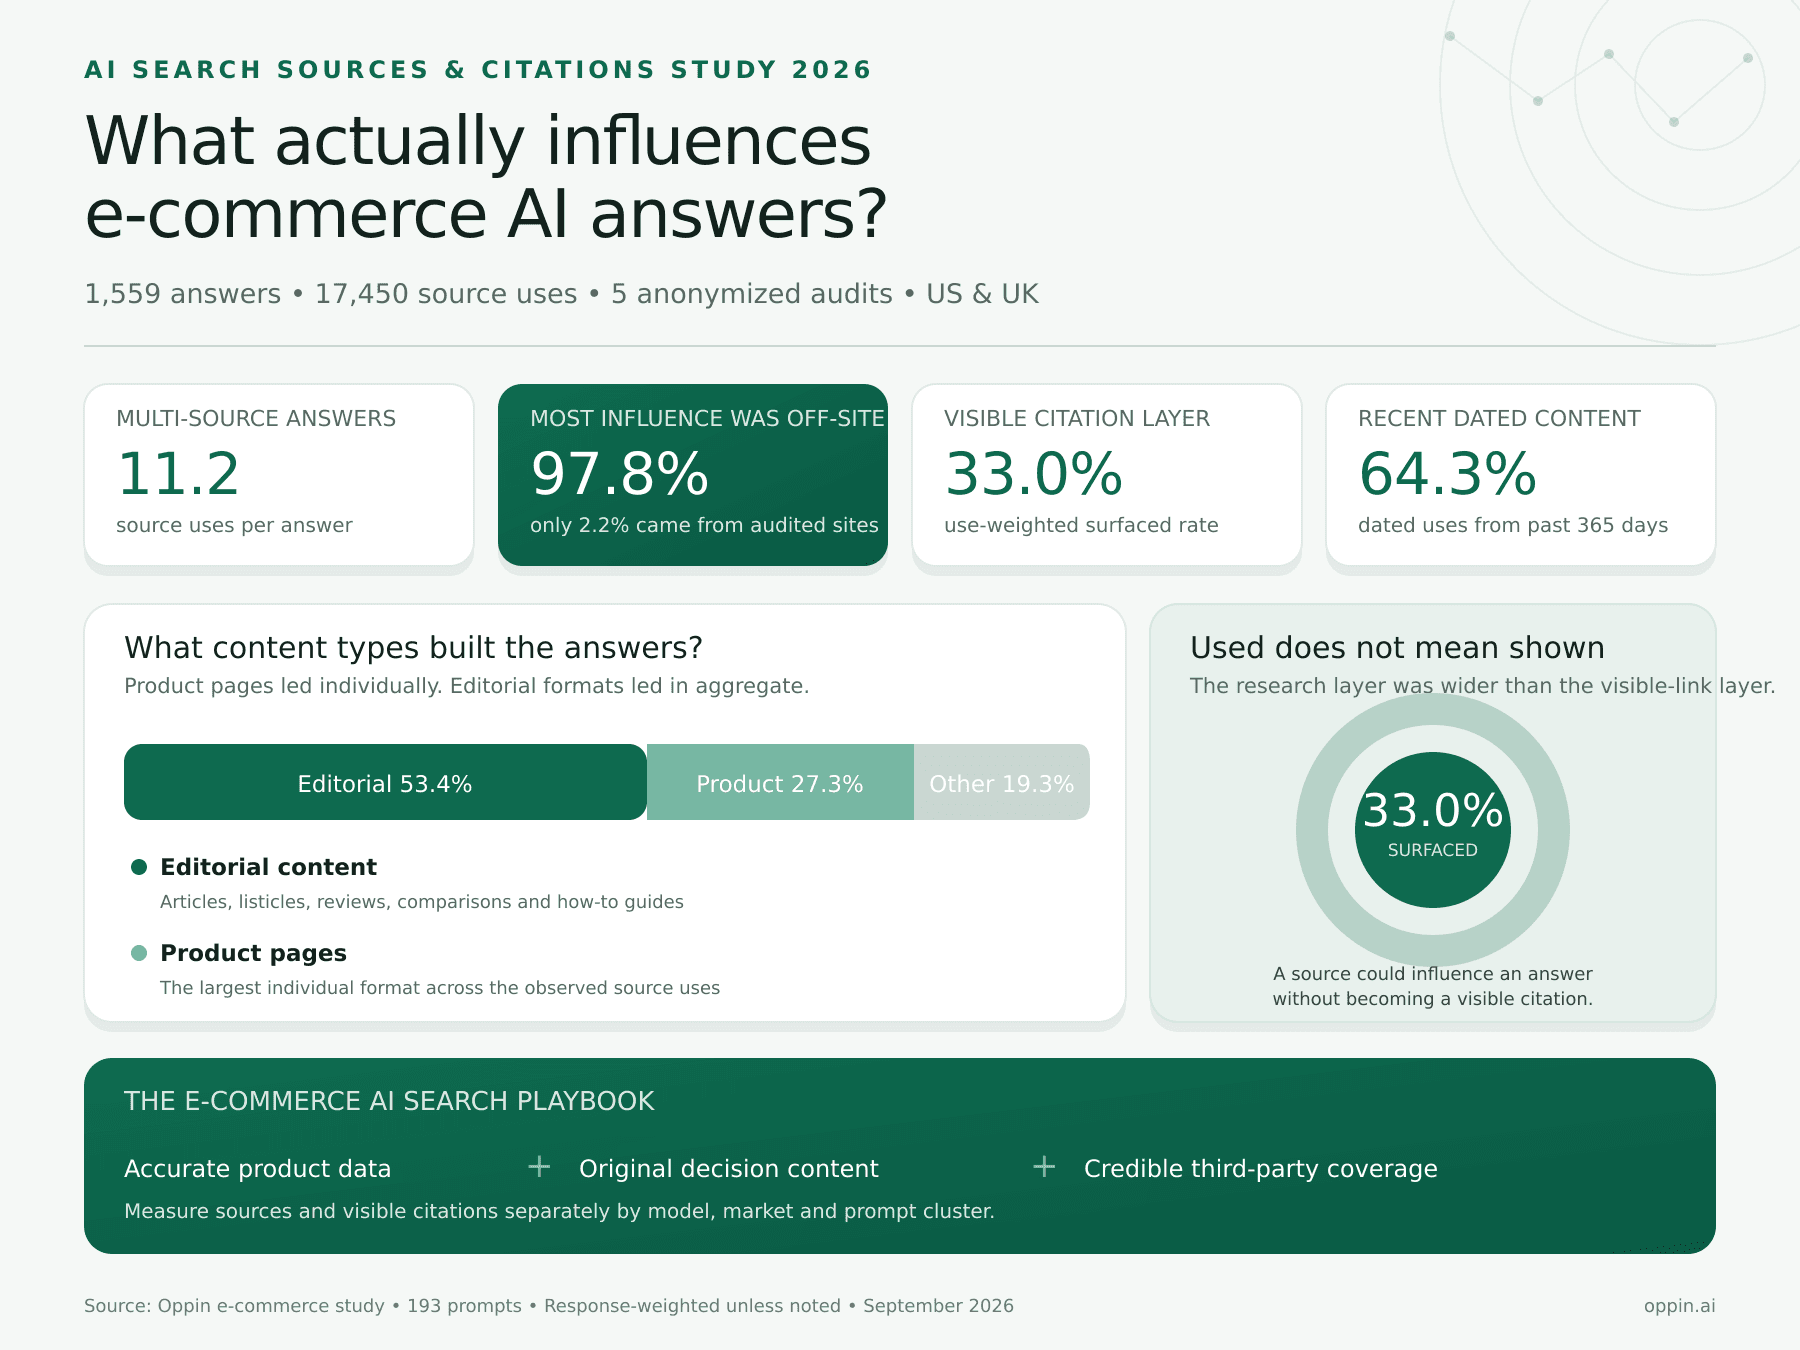
Source: Oppin E-Commerce AI Search Sources & Citations Study 2026.
Why sources and citations must be measured separately?
In AI search, a source is a page a model consulted while building an answer. A citation is a source the model surfaced as a visible link. Oppin’s glossary makes the distinction explicit: sources include background reading; citations are the subset shown to the user.
This matches the visible behavior of search-enabled assistants. OpenAI explains that ChatGPT answers may contain citations and a Sources view, while that view can also include other relevant links. Google says AI Overviews and AI Mode can fan out into multiple searches and supporting pages. A final answer can therefore be influenced by more pages than it visibly credits.
That difference changes the measurement question. Citation tracking tells you which links a shopper can click. Source tracking tells you which pages and domains are shaping the model’s research environment, including pages that influence an answer without receiving visible attribution.
A useful diagnostic High use with low surfacing suggests hidden influence but weak visible attribution. Low use with high surfacing suggests a source is highly citable when selected but rarely retrieved. High use and high surfacing is the strongest combination. |
|---|
Methodology
We analyzed anonymized Oppin exports from five e-commerce visibility audits. Four businesses were tracked in the United States and one in the United Kingdom. The audits covered 193 prompts and 1,559 AI-generated responses across ChatGPT, Gemini and Google AI experiences; one audit also included Google AI Overviews and Perplexity.
Dimension | Study scope |
|---|---|
Audits | 5 anonymized e-commerce businesses |
Markets | 4 US audits and 1 UK audit |
Prompts | 193 |
Responses | 1,559 |
Source uses | 17,450 in both the domain and page exports |
Domain records | 1,561 audit-level rows; 1,449 unique domains |
Page records | 3,693 audit-level rows; 3,654 unique URLs |
Models | ChatGPT, Gemini, Google AI; Google AI Overviews and Perplexity in one audit |
How the metrics were calculated
Used counts the number of times a domain or page was used across the tracked answers.
Share is that source’s portion of all source use within its audit.
Coverage is the share of responses where a domain or page appeared at least once.
Surfaced is how often the source was visibly shown in an answer. The study-wide surfaced rate is weighted by source use.
Response-weighted results preserve every observed source use. Brand-balanced results give each audit equal weight so the largest audit does not set the conclusion by itself.
Important limitations
This is a directional e-commerce study, not a census of every AI model, market or product category. One audit accounted for 69.9% of the answers, so response-weighted totals lean toward that category. We use equal-weight checks where they materially affect interpretation. Model coverage also varied by audit, which means this dataset should not be used to rank one AI model against another.
The analysis is observational. It shows which source patterns co-occurred with these answers; it does not prove that a page format or freshness window caused selection. Published dates were missing for 20.6% of source use, and a recorded date may represent the published or updated date supplied in the export. AI responses and source sets can also change between runs.
Finding 1: AI answers assembled a research stack
The 1,559 answers used sources 17,450 times, an average of 11.2 source uses per answer. The five audit-level averages ranged from roughly 10.5 to 17.8. This is a different environment from a classic results page where a brand mainly fights for one ranked position.
A shopping answer may need product specifications, prices, compatibility, safety information, comparative judgment and social proof. Those facts often live on different websites. Product detail pages can supply structured commercial facts, while publisher tests, government guidance, category specialists and community discussions help the system compare or contextualize them.
The practical unit of competition is therefore the source set behind the answer. E-commerce teams need to ask not only whether their own page ranks, but which combination of owned and third-party pages repeatedly enters the model’s research path.
Finding 2: 97.8% of source use happened off the audited sites
Only 387 of 17,450 source uses came from the five audited retailers’ own domains. That is a 2.2% owned-site share. The remaining 97.8% came from elsewhere on the web.
The pattern was not caused by one complete outlier. Owned-site shares across the five audits ranged from approximately 1.0% to 4.9%. Even the strongest audited site in the sample depended on a much broader external source ecosystem.
What this means for e-commerce teams Improving product pages is necessary, but it cannot create a complete AI-search presence by itself. Brands also need credible third-party pages that review, compare, explain, stock, test or discuss their products and category. |
|---|
Finding 3: Product pages led individually while editorial formats led collectively
Product pages were the largest single format at 27.3% of source use. That is an important e-commerce result: commercial pages are not excluded from AI research. Yet editorial formats had the larger combined footprint. Articles, listicles, reviews, comparisons and how-to guides together represented 53.4% of all source use.
Page format | Source-use share | Equal-audit share | Weighted surfaced rate |
|---|---|---|---|
Product | 27.3% | 25.3% | 32.6% |
Article | 22.1% | 18.9% | 27.7% |
Listicle | 20.3% | 24.4% | 39.8% |
Other | 13.4% | 9.3% | 29.9% |
Review | 5.1% | 3.6% | 29.9% |
Unclassified | 4.1% | 6.1% | 38.6% |
Comparison | 4.0% | 6.0% | 31.8% |
How-to | 1.9% | 4.2% | 41.8% |
Homepage | 1.4% | 1.7% | 48.6% |
Forum | 0.4% | 0.5% | 23.4% |
The equal-audit column is especially useful here. When every audit contributes the same weight, listicles rise to 24.4% and comparisons to 6.0%, while articles fall to 18.9%. The exact mix shifts, but the broad conclusion survives: useful editorial content is a major part of the e-commerce source graph.
The formats with the highest visible-citation tendency
How-to pages had a 41.8% use-weighted surfaced rate and listicles 39.8%, compared with 32.6% for product pages and 27.7% for articles. Homepages reached 48.6%, but they represented only 1.4% of total use, so their rate should not be treated as the dominant publishing opportunity.
The strongest editorial pages tended to make a specific job easier: choose between products, understand a safety issue, follow a process or evaluate tradeoffs. For example, a tested water-filter listicle from OutdoorGearLab was used 32 times and surfaced 81% of the time it was used. A TechRadar office-chair listicle was used 30 times and surfaced 57%. These are illustrations from this sample, not universal rankings.
Finding 4: Being used was not the same as being surfaced
The use-weighted surfaced rate across page records was 33.0%. At the page level, 32.6% of source uses belonged to URLs with a 0% surfaced rate in the export. At the domain level, 14.6% of uses came from domains with no visible surfacing.
A marketplace provides the clearest example. Amazon was the most-used domain in the combined export with 1,022 uses, or 5.9% of all source use, but its use-weighted surfaced rate was only 1.1%. The domain was highly present in the research layer and almost absent from the visible-link layer.
Example domain | Uses | Share | Surfaced | Interpretation |
|---|---|---|---|---|
amazon.com | 1,022 | 5.9% | 1.1% | High hidden influence; very low visible attribution |
factually.co | 810 | 4.6% | 43.0% | High use and moderate visible attribution |
pmc.ncbi.nlm.nih.gov | 548 | 3.1% | 32.0% | Institutional evidence source |
edmundyeo.sg | 406 | 2.3% | 94.0% | Highly visible when used in one audit |
reddit.com | 302 | 1.7% | 36.0% | Only domain besides YouTube used in all five audits |
outliyr.com | 268 | 1.5% | 25.0% | Strong use with lower visible attribution |
pubmed.ncbi.nlm.nih.gov | 251 | 1.4% | 53.8% | Research evidence with high visibility |
newswire.com | 245 | 1.4% | 7.0% | High use but weak visible attribution |
These domain examples are response-weighted and therefore reflect the larger audit’s influence. They are included to demonstrate the use-versus-surfacing pattern, not to declare universal e-commerce winners.
Finding 5: Recent content was common but not mandatory
A usable published or updated date was available for 13,849 source uses, or 79.4% of the total. Among those dated uses, 64.3% came from pages dated within the previous 365 days. The remaining 35.7% came from pages older than a year.
Freshness window | Source uses | Share of all uses | Share of dated uses |
|---|---|---|---|
0–90 days | 2,969 | 17.0% | 21.4% |
91–365 days | 5,939 | 34.0% | 42.9% |
1–3 years | 3,115 | 17.9% | 22.5% |
More than 3 years | 1,826 | 10.5% | 13.2% |
Unknown date | 3,601 | 20.6% | Not included |
Freshness appears important when product availability, current recommendations, pricing or safety guidance can change. But age alone did not disqualify a page. Older product guides and durable institutional resources still appeared when they remained relevant or authoritative.
For publishers, the better rule is to keep decision-critical facts current and make the update visible. A cosmetic date change without a substantive review of products, evidence or availability is unlikely to build the same trust as a genuinely maintained page.
Finding 6: Every category formed a different source graph
The combined dataset contained 1,449 unique domains, but only 83 appeared in at least two of the five audits. That means just 5.7% of unique domains crossed category boundaries. Reddit and YouTube were the only domains present in all five audits.
The long tail was substantial. The top 50 domains generated 51.0% of source use, while the top 100 generated 64.6%. More than one thousand additional domains supplied the remaining influence. An e-commerce brand therefore needs a category-specific source map, not a generic list of “sites AI trusts.”
Domain type | Source-use share | Equal-audit share | Weighted surfaced rate |
|---|---|---|---|
Corporate / Product | 25.0% | 21.6% | 30.1% |
Retail / E-commerce | 24.3% | 23.0% | 28.9% |
Blogs | 21.3% | 22.4% | 40.9% |
News / Media | 10.5% | 11.9% | 35.9% |
Government / Institutional | 10.3% | 12.2% | 37.2% |
All other types | 8.6% | 8.9% | — |
Commercial sources supplied almost half of all use when corporate/product and retail/e-commerce sites were combined. Blogs contributed another 21.3%, while public institutions mattered heavily in prompts involving health, safety, food handling, ergonomics or water quality. Query intent changed the source mix.
What e-commerce brands should publish
The data points to a two-layer content strategy. Owned product information supplies accurate facts; editorial and third-party content supplies context, comparison and corroboration. The strongest programs develop both.
1. Complete product pages for factual retrieval
Product pages should make price, availability, variants, materials, dimensions, compatibility, shipping, returns, warranties and evidence easy to find in crawlable text. Avoid placing critical facts only inside images, tabs that cannot be crawled or client-side interfaces that fail without interaction.
Google recommends product structured data and Merchant Center feeds to help it understand product details and maintain fresher information such as price and availability. Structured data is not a special AI-search shortcut, but it is still valuable commerce infrastructure.
2. Tested comparison and best-of pages
Listicles and comparisons should disclose how products were selected, which attributes were tested, who the page is for and where tradeoffs exist. Include original photos, measurements, screenshots, scoring logic and reasons a product was excluded. A generic roundup that repeats manufacturer copy adds little that an answer engine cannot synthesize elsewhere.
3. How-to and troubleshooting content
How-to pages were a small share of source use but had one of the strongest surfaced rates. Publish instructions around setup, sizing, maintenance, cleaning, compatibility, storage, use conditions and common failure modes. Answer the task fully before moving into product recommendations.
4. Evidence and safety explainers
Government and institutional sources accounted for 10.3% of source use and surfaced at a 37.2% weighted rate. Categories involving health, food, ergonomics, water or safety should cite primary research and public guidance, distinguish evidence from marketing claims and include qualified review where appropriate.
5. Original category data
Publish mini-studies that competitors cannot easily reproduce: return reasons, durability tests, fit or sizing distributions, customer-support themes, compatibility databases, seasonal demand or controlled product comparisons. Document the sample, dates, method and limitations so the findings can be cited responsibly.
6. Third-party source development
Because 97.8% of source use occurred off the audited sites, digital PR, expert commentary, independent reviews, retailer listings and legitimate community participation matter. The goal is not manufactured mentions. It is to make accurate, experience-backed information available on the domains already shaping the category.
Technical foundations still matter
Google’s current generative AI guidance emphasizes unique, expert-led content and a clear technical structure. For Google’s AI features, supporting pages must be indexed and eligible to appear with a snippet. Google also says there is no special AI schema or required AI text file.
Allow appropriate search crawling and check CDN or bot-management rules.
Use descriptive internal links so category hubs connect to products, comparisons, guides and research.
Keep important claims and specifications in visible, crawlable text.
Make structured data match what users can see on the page.
Maintain Merchant Center feeds and synchronize price, availability and shipping data.
Use canonical URLs and control faceted-navigation duplication on large catalogs.
Show authorship, testing methods, publication dates and meaningful update notes on editorial pages.
A 90-day e-commerce AI source plan
Window | Objective | Actions | Measures |
|---|---|---|---|
Days 1–15 | Build the source baseline | Track priority prompts by model and market. Separate sources used from links surfaced. Tag domains by type and page format. | Source directory; owned share; surfaced rate; competitor source gap |
Days 16–30 | Fix product-data foundations | Audit crawlability, canonicals, Product markup, Merchant Center feeds, price, availability, returns and shipping. | Valid product data; fewer feed mismatches; indexed priority pages |
Days 31–60 | Publish decision content | Create one tested comparison, one how-to cluster and one evidence-led category guide based on recurring prompt needs. | New source appearances; coverage by prompt cluster; cited pages |
Days 61–75 | Develop external authority | Prioritize credible publishers, reviewers, retailers and communities already used in the category. Offer original data or product access. | Earned source mentions; independent reviews; cross-domain coverage |
Days 76–90 | Measure and iterate | Compare use, surfaced rate, brand mention, sentiment and position. Refresh pages that are used but rarely surfaced. | Source-to-citation conversion; owned share; visibility change |
What to measure every month
Owned source share: the portion of source use from your own domain.
Source coverage: how many tracked answers consult a priority domain or page.
Surfaced rate: how often a used source becomes a visible link.
Source diversity: concentration across retailers, publishers, institutions and communities.
Competitor source gap: domains and page types supporting competitors but not your brand.
Freshness exposure: share of source use from recently updated decision-critical content.
Market and model split: changes that disappear when all countries and systems are blended.
Frequently asked questions
What is an AI search source?
An AI search source is a URL a model retrieves or consults while building an answer. It may influence the answer even when the user never sees a link to it.
What is the difference between a source and a citation?
A source is part of the model’s research process. A citation is a source surfaced as a visible link in the answer. The distinction matters because source influence can be much broader than visible attribution.
Do product pages influence e-commerce AI answers?
Yes. Product pages were the largest single page format in this sample, accounting for 27.3% of source use. They work best when product facts are complete, current, crawlable and consistent with structured data and merchant feeds.
What content type was most influential overall?
No single format dominated. Product pages led individually, while editorial formats like articles, listicles, reviews, comparisons and how-to guides represented 53.4% of source use in aggregate.
How fresh should e-commerce content be for AI search?
Among source uses with a known date, 64.3% came from pages dated within the previous year. Freshness was common, but older authoritative pages still appeared. Update facts when products, evidence, pricing or availability change; do not change dates without materially reviewing the content.
Does structured data guarantee an AI citation?
No. Google says no special structured data is required for its generative AI features. Product structured data and Merchant Center feeds can help systems understand commerce facts and qualify pages for other search experiences, but they do not guarantee retrieval or citation.
Should e-commerce brands target Reddit and YouTube?
They deserve monitoring because they were the only domains present across all five audits. But the right tactic is category-specific. Publish useful video where demonstrations matter and participate transparently in communities where customers already exchange experience.
How can an e-commerce team track sources and citations?
Track a stable set of prompts by model, country and topic. Record every domain and page used, whether it surfaced as a link, whether it mentioned the brand and how the source set changes after content or authority work. Oppin is designed to aggregate those source and citation patterns across tracked AI responses.
Conclusion
The e-commerce source graph is broader than a product catalog and more fragmented than a traditional ranking report. In this sample, AI systems repeatedly combined commercial pages, editorial judgment, institutional evidence and community signals. Most of that influence occurred off the audited sites, and only part of the research layer became visible citations.
The practical strategy is clear: make owned product information accurate and retrievable, publish original decision-support content, build legitimate authority on the third-party domains that shape your category, and measure sources separately from citations. That is how an e-commerce team moves from guessing what AI systems read to improving the source environment they actually use.
Want to see which pages influence answers in your category? Explore how Oppin tracks sources, citations and query fan-out across models, markets and competitors.